.png?width=1322&height=525&name=LEANSITE%20LOGO%20(COLORED).png)
What this article covers
This guide covers creating, arranging and sharing one dashboard in the FM Portal. It does not define the calculations behind each widget; use the relevant analytics article when a measure needs interpretation.
Before you start
Decide what the dashboard should help its readers monitor. Keep the first version focused on one operational question, such as open work, completion performance or vendor performance. You also need permission to create and share dashboards.
1. Start a dashboard
Select Dashboards in the FM Portal, then select Create Dashboard. Enter a clear Dashboard Name.
You can select Create New under Start from blank canvas, or choose a prepared template. The visible templates include:
- Executive Review, for portfolio health, spend, delivery, vendors and open critical issues;
- Vendor Scorecard, for vendor rates, cost and rankings;
- Weekly Ops Digest, for work-order completions, SLA breaches, resolution trends and team workload.
Choose the starting point that is closest to the question you want to answer, then select Next.
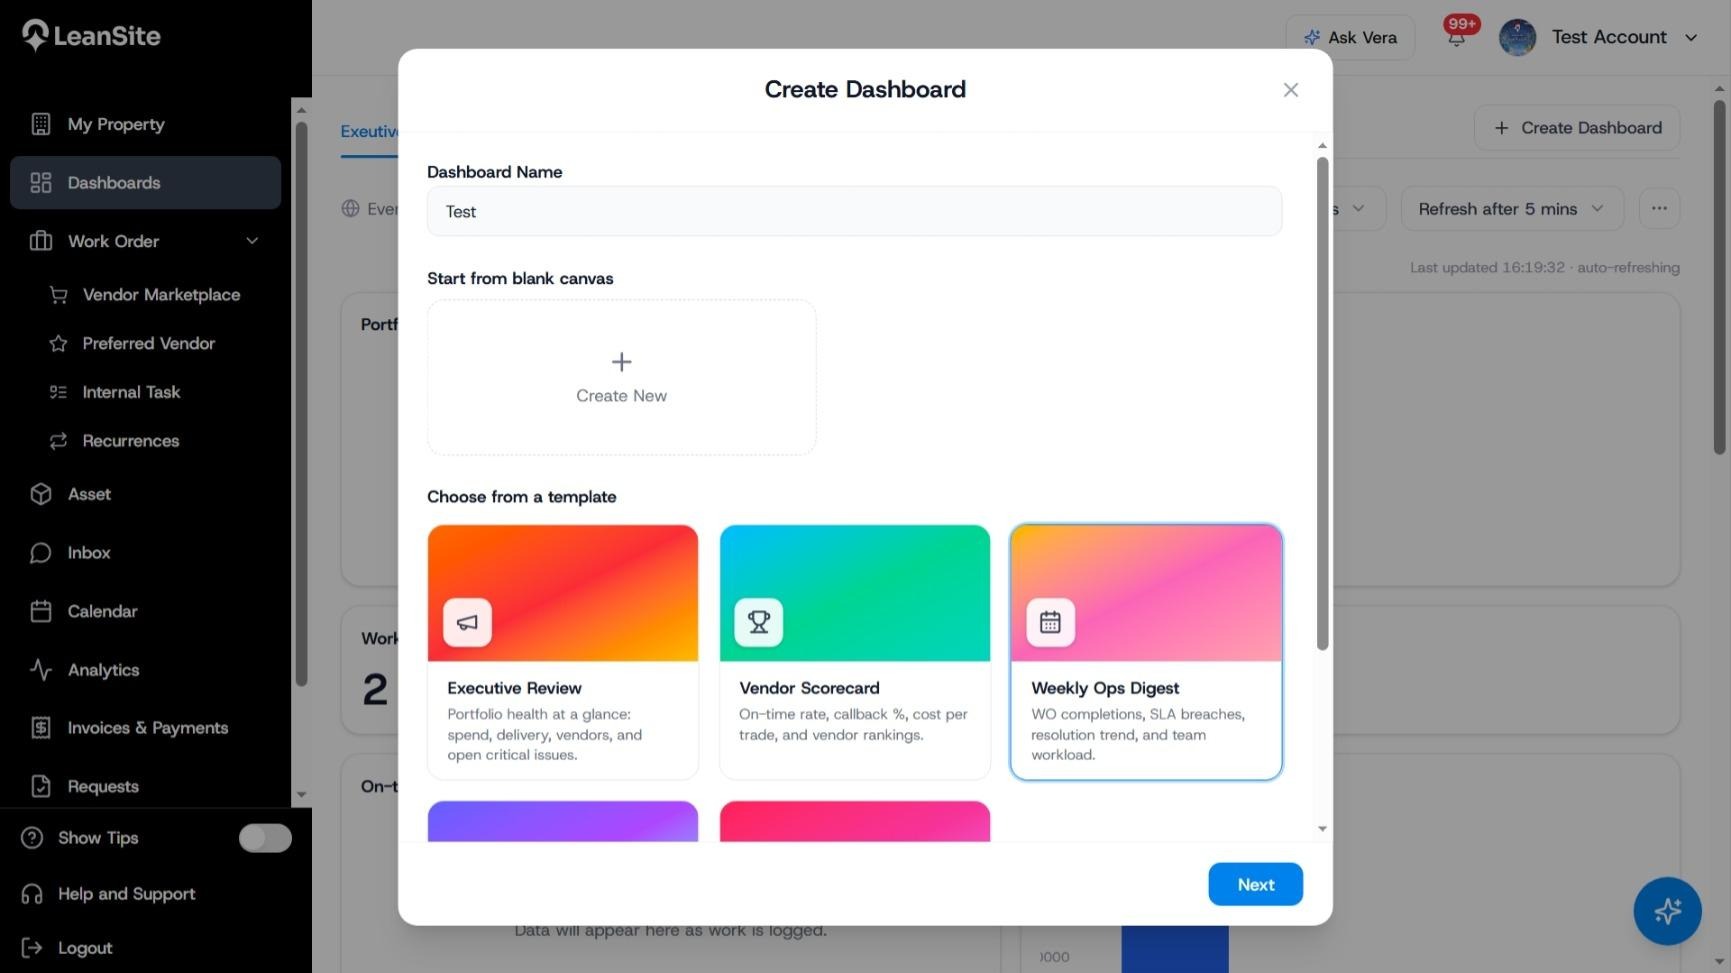
Alt text: Create Dashboard window showing the dashboard name, blank-canvas option and available templates.
2. Choose the widgets
Use the Widget Library to find and select the measures required for the dashboard. The visible work-order widgets include Open Work Orders, Overdue Work Orders, Work Orders Created, Completion Rate, On-time Completion, Average Resolution Time, Average Cost per Work Order, Resolution Time by Category, Resolution Trend and Bid Count Distribution.
Selected widgets show a tick and appear on the canvas. Remove measures that do not help the dashboard’s intended reader.
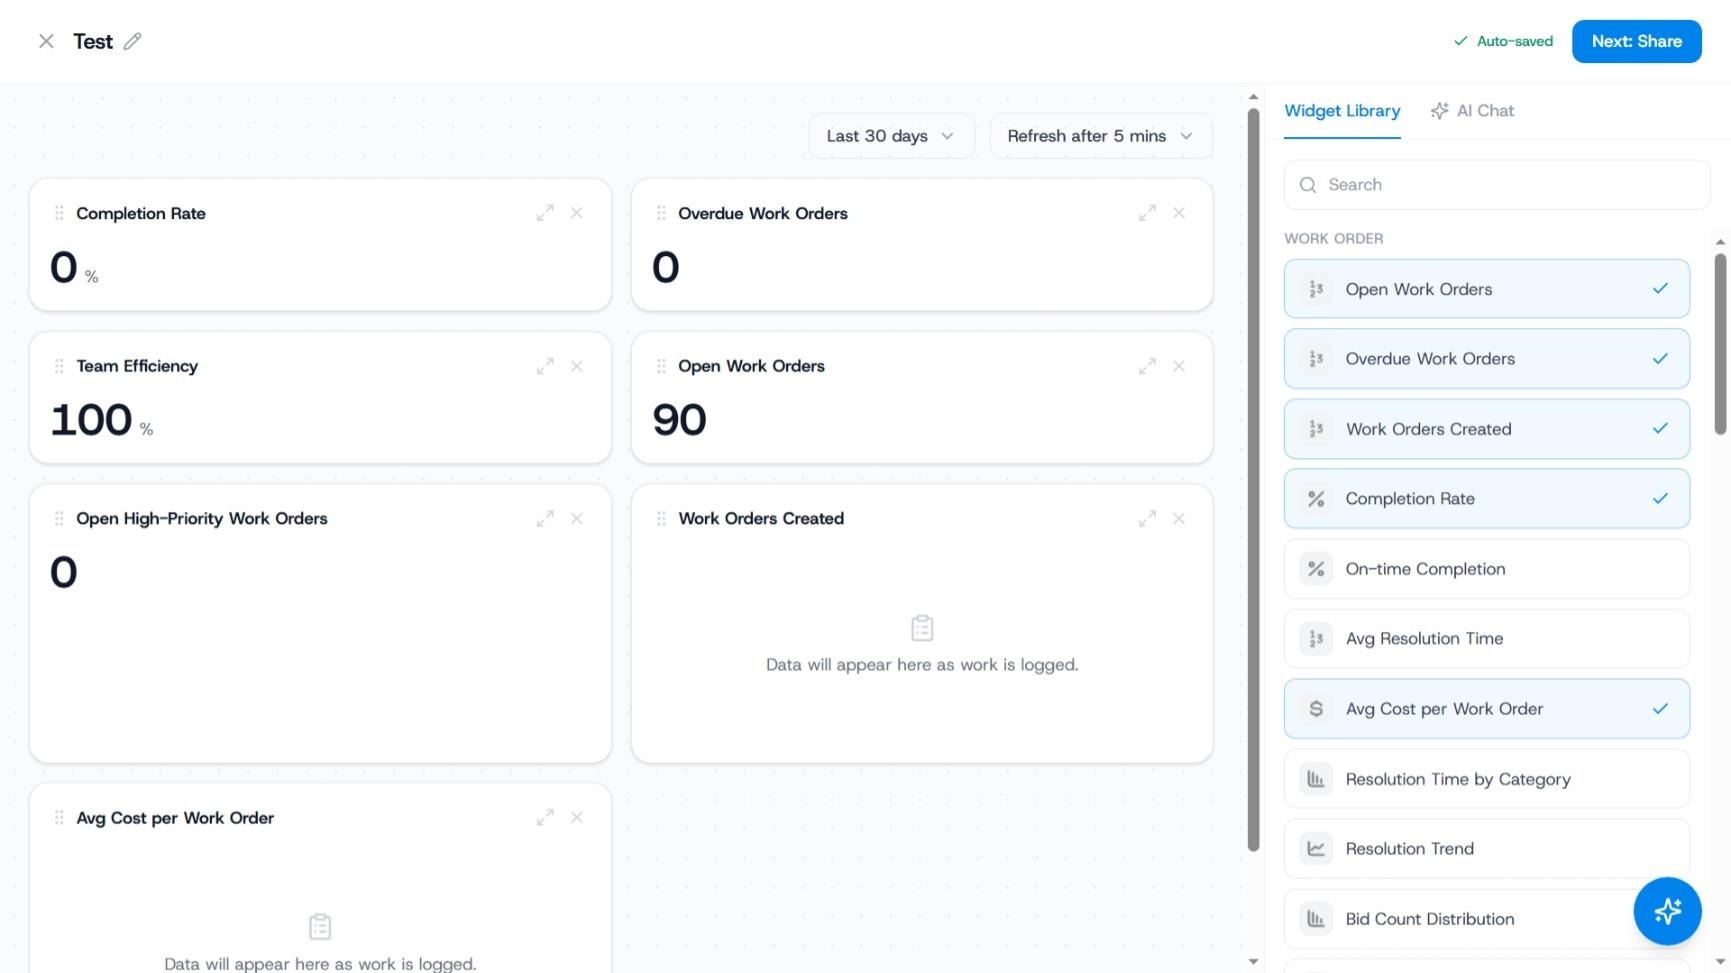
Alt text: Dashboard builder with selected work-order widgets and the Widget Library open.
3. Arrange the dashboard
Move the selected cards into a useful reading order. Place the most important headline measures first and keep related measures together. LeanSite shows Auto-saved while you work.
Use the time-range and refresh controls shown above the canvas to set the view required for this dashboard. The selected range and refresh interval affect how readers interpret the figures, so keep them visible when reviewing the result.
4. Continue to sharing
When the content is ready, select Next: Share.
Choose who can find the dashboard:
|
Sharing option |
Who can find it |
|---|---|
|
Private |
You and governance, including the Organisation Owner. It is hidden from peers. |
|
Public |
Named individuals and internal teams. Team membership remains in sync. |
|
Org-wide |
All internal members can discover it. Each widget remains permission-gated when opened. |
Sharing controls discovery of the dashboard. It does not widen a person’s access to properties or data they are not permitted to view.
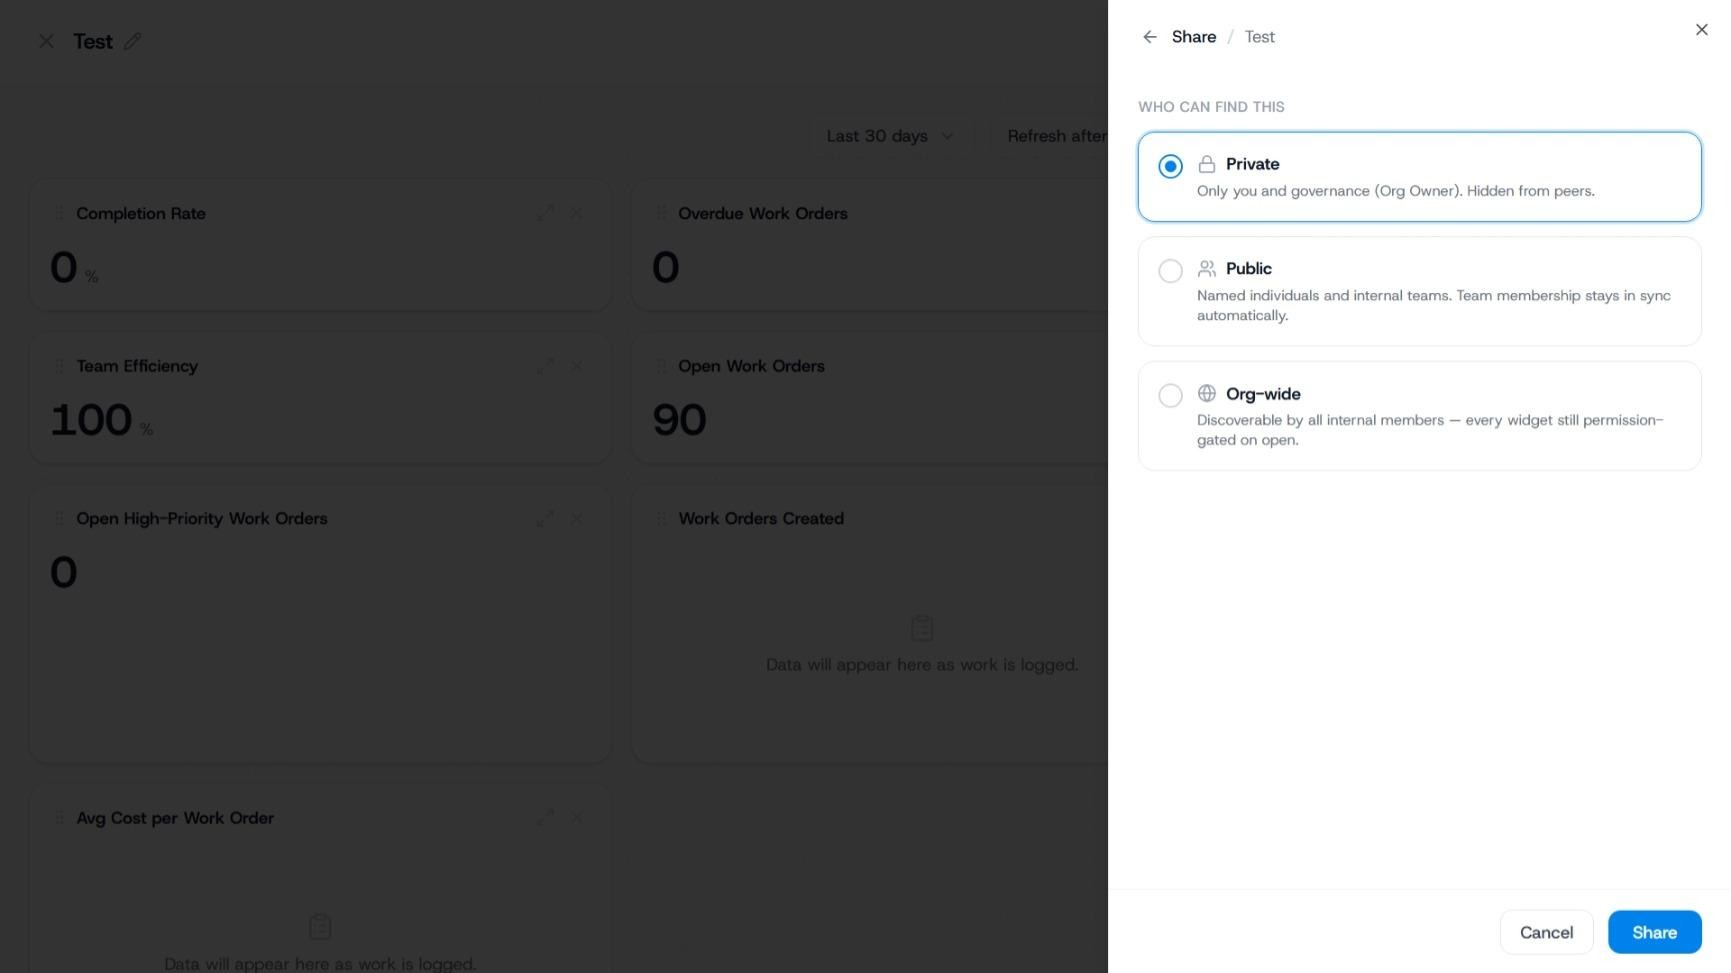
Alt text: Dashboard sharing panel with Private, Public and Org-wide options and their visibility descriptions.
5. Create and share the dashboard
Review the sharing choice and select Share. LeanSite returns to the Dashboards page and displays Dashboard created and shared.
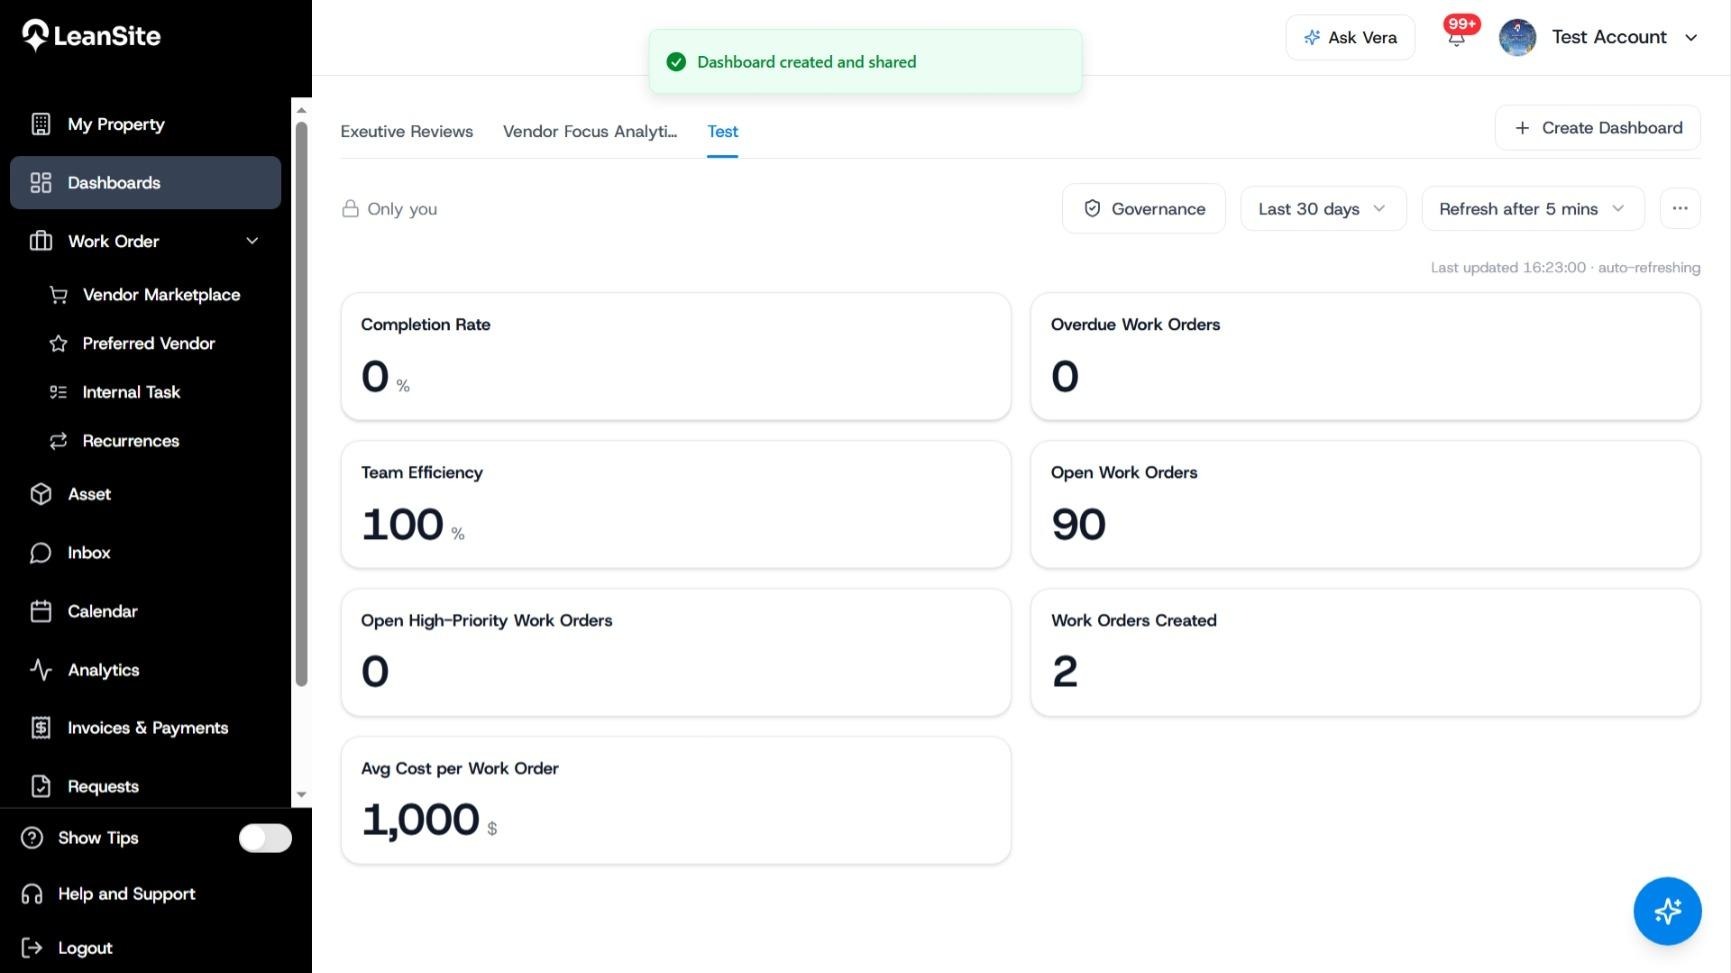
Alt text: Completed dashboard with operational widgets and the Dashboard created and shared confirmation.
Expected result
The dashboard appears as a named tab in Dashboards, contains the selected widgets and uses the sharing level you chose.
If the figures differ between viewers
Check the dashboard’s time range, refresh interval and the viewers’ property permissions. A shared dashboard can display different values when viewers have access to different locations. Review the source Analytics page when a metric needs deeper investigation.